Blogs
Welcome to our blog, where we share insights, tips, and stories on everything that's worth talking about in recruitment marketing. Take a look at our expert advice, and thought-provoking discussions - all in one place!

Stand out in a saturated market. A practical 2026 marketing playbook for Dubai-based recruitment agencies ready to attract better clients and talent.

Is your marketing strategy aligned with your tech stack? Here’s how recruitment agencies can build a 2026-ready growth engine.
A mobile-optimised website is the pillar of marketing for recruitment agencies. Here’s how to make your site mobile friendly.

Is your recruitment agency website stuck in 2019? Here’s how to turn it into a lead-generating machine with smart UX and solid content.

AI search is changing recruitment marketing. Discover why Generative Engine Optimisation (GEO) is a game-changer for recruitment agencies.
Learn how AI platforms are changing SEO for recruitment agencies and how to adapt your SEO strategy to get ahead.
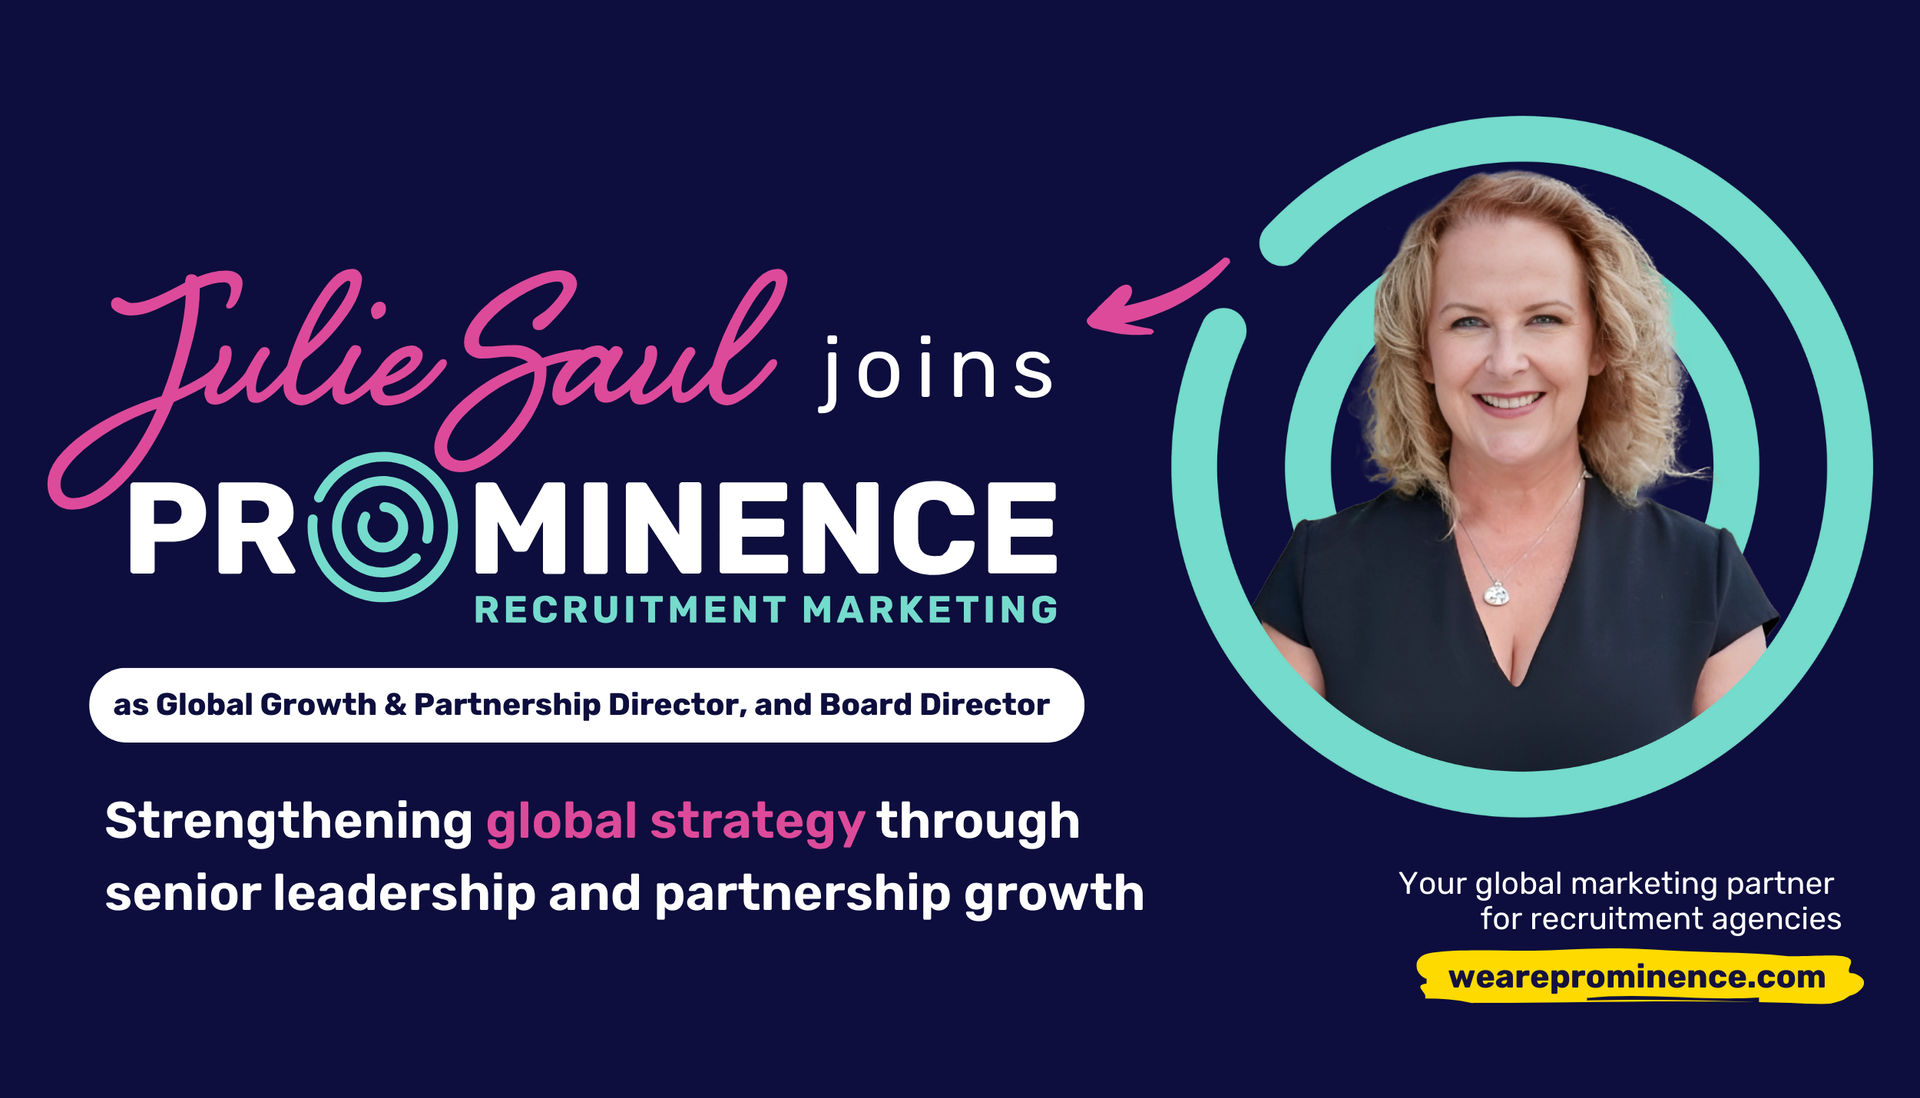
Prominence Recruitment Marketing appoints Julie Saul as Global Growth & Partnership Director and Board Director. With 30+ years in recruitment, Julie brings unmatched experience in scaling and growing recruitment businesses worldwide.

Good SEO is essential for attracting clients and candidates to your recruitment agency website. Here’s tips on the content that works best.

Here’s why EVP is a major puzzle piece in marketing for recruitment agencies and how you can position your agency as an employer of choice.

Shouting louder won’t help you stand out as a recruiter. Smarter marketing, strong branding, and real relationships will. Learn how here.

A diversified marketing strategy is key to growing your recruitment agency. Here’s how to build one that actually creates results.
To stand out from the competition, effective marketing is more important than ever for recruitment agencies. Without it, your business growth can quickly hit a brick wall and force your consultants to fish in the same pool of prospects. That’s hardly enjoyable or productive (even if your consultants won’t admit to it!) In a highly competitive market, the good news is that you can optimise your costs with outsourced recruitment marketing and access capabilities that can take years to build in-house. We’ll explain why and how. The Real Costs of In-House Marketing The average marketing budget sits somewhere between 7-10% of company revenue, as surveys by Deloitte and Gartner suggest. (If you’re in start-up or high growth mode, that percentage will be higher.) Plans to increase marketing budgets over the coming years will, of course, vary by industry and business needs, but it’s clear that internal marketing teams don’t come cheap. For businesses based in the UK, the average marketing coordinator salary is in the vicinity of £24,000. With the recent increase in the employer National Insurance Contributions rate (from 13.8% to 15%), recruitment agencies are now facing significant payroll costs – and that’s before any marketing is being done to speak of! Breaking it down, an in-house marketing coordinator on a minimum salary of £22k will cost an additional £770 annually from 2025, whilst a midweight marketer on £45k will cost at least another £1,000. Add that up over a team of two to four people (or more), along with leave entitlements and other employee costs, and those pounds sure add up. Not to mention the cost of replacing and onboarding marketing employees. Recruitment agencies in Australia don’t get off lightly, either. To employ a full-time marketing coordinator, you’re looking at an average salary range of $70,000-$80,000 AUD. Add in superannuation, payroll tax, minimum leave entitlements, along with onboarding and training, the actual annual cost of that coordinator will be 1.25 to 1.4 times higher than their base salary. That’s up to $122,000 annually for one employee with a limited skillset. Here’s the catch: a junior or midweight marketing coordinator can handle the basics, but when your business needs specialised marketing skills to grow, you’ll need to hire more specialists – and that’s when your costs will skyrocket. Access to Marketing Expertise Without Hiring With outsourced marketing, you can skip the fixed, ongoing expenses of an in-house marketing team. Outsourcing gives you access to specialised skills like graphic design, paid advertising and copywriting when you need them, without the ongoing overhead of salaries and taxes. After all, your business might not need the same set of marketing skills all year. Certain expertise is more important for some campaigns and marketing plans and not others. When using an outsourced marketing agency like us, you get access to an embedded marketing team where you only pay for work you need during a given project or timeframe. We act as an extension of your business to manage your marketing, giving you a range of established skills and strategic knowledge at your fingertips. All without making a single hire. Scalability Based on Business Needs An outsourced marketing solution gives you precious scalability. As all recruitment business leaders are aware, business conditions fluctuate. Your goals will inevitably be adjusted to meet changing market conditions. Based on our experience in working with recruiters, here are common scenarios where marketing scalability is a survival issue: 1. Crowded Markets In crowded industries and sectors, recruiters face stiff competition from rivals with big marketing budgets. To stay ahead, they need smart and adaptable strategies that pack a punch without overspending. 2. Start-Up Challenges For new recruiters with limited revenue and an unproven offering, the focus is on generating interest and building momentum quickly. Outsourced marketing will provide that essential lift-off without the risk of hiring an untested marketing coordinator. 3. New Ventures and Expansions Recruitment agencies launching a new service or breaking into a new market will need a surge in marketing resources to ensure their efforts pay off. Scalable marketing means recruiters can dial their efforts up or down as needed. No overcommitting, nor missing out on opportunities! How do you achieve this sweet scalability? With an outsourced marketing solution, one that gives you flexible pricing options and a solid range of capabilities. If you want to pay on a project basis or have a marketing team on retainer, a good marketing agency will give you those options, too. This helps you forecast and manage costs over any length of time. Reduced Hidden Overheads On top of staffing costs, there are a few other cost gremlins lurking under the floorboards that most companies aren’t aware of until it’s too late. Infrastructure expenses like marketing software and tools quickly add up, especially when you need a group subscription or must pay a premium for basic functionality. An outsourced marketing provider has all these necessary tools, so you don’t need to duplicate them. Even the office space you need for an in-house team can sometimes get overlooked – an often astronomical cost that is becoming harder to justify for many businesses! Engaging a marketing agency gives you access to a marketing team at your fingertips, without the expense of bums on seats. The Final Word Of course, there are many situations where it makes good business sense to maintain or grow an in-house marketing team. The key, however, is to understand the big picture: your balance sheet, the ROI you can reasonably expect from an in-house team, and which options will best enable you to stay agile in a challenging market or business phase. Understanding these factors will guide you to the right marketing solution and avoid expensive mistakes. Outsourced Marketing for Recruiters, Done Your Way We’ve sung the praises of outsourced marketing here, but we’re also experts at helping our clients get the best out of their internal marketing teams. Whether you’re seeking marketing specialists that can dovetail with your internal team, or a standalone solution, or something else, we can do it for you. Let’s talk! Get in touch with Prominence today – we’d love to hear from you.