
How to Measure Return on Social Media Investment
What would happen if you stopped posting content to your social channels for a week or even a month? My guess is that in most cases it would make no difference to your recruitment or careers business.
This is because the majority of recruitment firms or internal talent teams are only playing lip service to social media. Posting occasional blogs and semi-regular mainstream media articles to small audiences is enough to show a social media presence, but only requires minimal investment. As you can probably guess this lack of investment results in limited returns. This creates a vicious cycle, which is where most businesses remain. The only way to generate results from social media is to invest in strategy and content and the only way to be sure this investment is working is to know how to measure your returns.
This article provides an overview on how to measure the success (or failure) of your online marketing strategy.
Good News
The good news is that when compared to traditional marketing mediums social and digital media make it easier to measure results. That said there are always going to be some results that remain qualitative, but these techniques and tools will help you to spot positive or negative trends.
Don’t Rely on Platform Statistics
There are lots of unscrupulous companies out there selling Twitter followers or Facebook likes. This is one of the main reasons that platform specific social media audience numbers are a poor indicator of online success.
I accept that if a company has 40,000 Twitter followers compared with 100 the larger audience is going to provide significantly increased post visibility. However just because a business page has a large audience it isn’t a guarantee of user engagement or that the audience will see the content. This is because of post visibility algorithms that are in place to restrict the visibility of organic posts. These restrictions are designed to maintain the quality of the user experience (by preventing spam) and to encourage businesses to undertake paid advertising.
Therefore once your online presence is social proofed (enough likes or followers to give your business credibility) the value of additional likes and followers is minimal and often purely correlates with the amount of advertising revenue spent on the related platform.
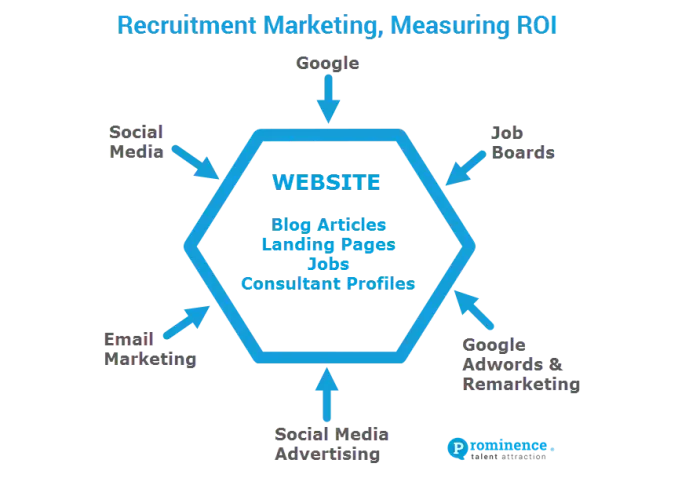
Recruitment / Careers Website
A well designed and functional website is vital to the successful measurement of online marketing success. We go into greater detail on what to consider when building a new website here, however to enable your business to measure results you just need to be aware that your website should act as a centralised hub for all marketing traffic.
Importantly traffic will likely not enter the site through the one location, instead coming in to jobs, consultant profiles, landing pages, company blogs or other pages.
Google Analytics
To measure the traffic results of a website or careers portal, I recommend using Google Analytics. It is one of the best free tools available on the internet, providing all the functionality needed, without having to pay for complex third party solutions.
As an example we recently ran a client campaign and on the day we posted some organic (free) marketing content to a Facebook Group we could immediately see that we generated over 1000 additional website visitors.
Whilst Google Analytics is a great tool if you aren’t used to online marketing it can be confusing or worse provide misleading results. So below is an overview to get you started on Analytics.
Audience
Start in the Overview tab, from here you can get day by day (or even hour by hour) break down of all website traffic plus can see the following:
Sessions – the amount of times your website has been visited
Users – the amount of unique visitors, generally more important than Sessions as it eliminates repeat visitors
Average Session Duration – how long someone is on your site, which is a good indication of how much relevant content there is available for them to review
NB. If your marketing solutions are working each of these metrics should be increasing over time
New & Returning Visitors – this pie chart provides information on how many of your website users return to the site. As a recruitment business it is healthy to have returning visitors, this shows positive engagement and that they see your site as a good source of jobs. Mobile – On the left hand side there is also a sub-tab labelled Mobile, from here you can see the percentage of web traffic that comes from both mobile and desktop.
Acquisition
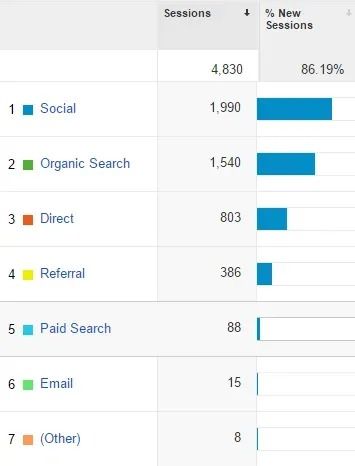
This tab provides information on where your website traffic originates. This is incredibly powerful data that allows you to review the effectiveness of platform specific activities. The initial chart breaks the traffic by high level source. In this example Social [Media] is the highest contributor, followed by Organic Search (generally Google). Each of these traffic sources can then be further expanded to show specific sources, for instance clicking Social will show traffic results from each social network.
Note that when you click Organic you will see some of the keywords that have been searched, but the majority aren’t visible.
Behaviour
This tab is useful to gain an insight into which landing pages your users arrive on and then using the Behaviour Flow sub-tab you can see where users next navigate.
Conversions
This is perhaps the most important of the tabs. By setting up Goals, Analytics shows how many of your website users completed a specific action. For recruiters these actions are most commonly setup to record when a candidate applies to a job or when a client registers for a whitepaper or similar. From the Goals sub-tab you can see the total user goal conversion rate (as a percentage) and by clicking the Source / Medium link Analytics shows the specific sources that these converted users originated from.
Example 1, Return on Investment on Job Boards
Onestop Recruitment spent $4,000 a month on a job board, this led to 500 website visits, of which 200 users applied or registered their details.
At a ratio of 100 applicants to 1 placement with an average fee of $13,000, this campaign resulted in $26,000 revenue at a cost of $4,000.
Example 2, Return on Investment on a Social Campaign
Fasttrack Careers spent $5,000 preparing a labour trends whitepaper, $1,500 designing graphics for an online marketing campaign and $2,000 promoting the content across the social channels. This spend led to 5000 website visitors and 35 client registrations requesting to have the whitepaper delivered.
At a ratio of 5 clients visits to 1 placement and an average fee of $8,000 this campaign resulted in $56,000 revenue at a cost of $8,500.
NB. Working out the placement ratios is a little harder as it relies on additional data, most databases now have this functionality or it can be manually tracked over a period of several months.
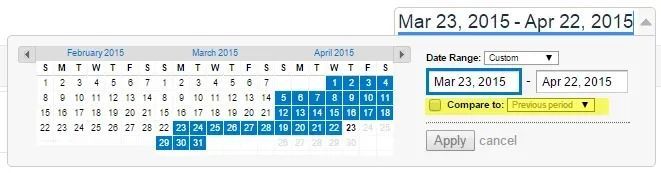
Measuring Brand Growth
Whilst campaigns can be tracked using goal conversions improvements in brand strength and recognition are harder to measure. Rather than using goals, data should be compared with the month previous and the same month the year before. This tracks on-going progress and also ensures seasonal fluctuations are taken into consideration.
To run comparison data select your current data range and then click Compare to and enter the dates of your choosing.
Additional Insights
Relevant data can also be
monitored using the analytics
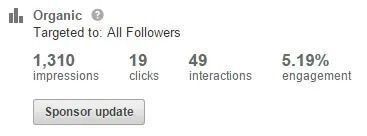
reports from each social application or third party suppliers. In some cases this data can only be used to verify the accuracy of both sets of results, but in others additional insights can be found.
LinkedIn analytics are a good example of these additional insights, highlighting the amount of interactions that occur on both organic and paid posts. Interactions are then shown as a percentage of the total user impressions, providing an indication on how relevant and engaging the post content was.
Conclusion
The data from Google Analytics is considerably more important that the number of likes or followers your business has, but it isn’t the only measurement tool available.
By setting up your recruitment business with a strategy that revolves around a centralised marketing hub, it will be easier to justify and monitor spend on marketing projects that previously would have held too much risk. Hopefully this will help your business get ahead of your competition as they continue to pay lip service to one of the most rewarding marketing channels.
We also put together a quick marketing self-review, feel free to give it a go here.
About The Author
Chris has worked in the recruitment industry for eight years, where he has been fortunate enough to spend considerable time getting to know the inner workings of three different recruitment sectors in both New Zealand and the United States.

Now running Prominence Chris and the team consult with recruitment agencies and employers on strategies that produce better access to talent. Services include social recruitment training, recruitment agency marketing, employment branding and job marketing conceptualisation and design.
Chris is an active speaker and has successfully delivered lecture and seminar based content across all areas of social recruitment. Chris also volunteers as a speaker at tertiary education facilities to provide real world advice to students and career counsellors on how best to utilise social media for job search purposes.
Chris can be found on Twitter
@findsouth
Our Case Studies
Below is a selection of our case studies showcasing the projects we’ve delivered, the sectors we specialise in, and the long-term partnerships we’ve built. Each one highlights the challenges faced, the approach taken, and the results achieved.


Sound like we could be a good fit for you?
Fill in the form below and we'll be in touch to see where your recruitment business is heading and how our ready-to-go marketing team can support you.
Ready for a chat
We will get back to you as soon as possible.
Please try again later.